

Boost Your Website Performance with Optimal Page Speed Tips
Optimizing Your Landing Page Load Speed for Better Performance and Higher Conversions
Landing page load speed is the measurable time it takes for a targeted landing page to render its primary content and become interactive, and improving it directly reduces abandonment and increases conversions. Fast load times work by minimizing payload, render-blocking work, and server latency so that users perceive the page as responsive, which in turn preserves attention and trust. This guide explains what landing page load speed is, how Core Web Vitals map to user experience, and why a sub-2.5 second Largest Contentful Paint typically yields better conversion outcomes. You will learn how to measure speed with the right tools, prioritize fixes based on business impact, implement image, code, caching and server optimizations, and monitor performance continuously. The article then shows how to integrate speed optimization with paid traffic strategies like solo ads to protect ad spend and improve ROI. Throughout we use practical checklists, comparison tables, and measurement guidance so you can audit, fix, and scale landing pages used in paid campaigns.
What Is Landing Page Load Speed and Why Does It Matter?
Landing page load speed is the end-to-end time for a landing page to present primary content and accept user interaction, which matters because it directly influences perceived performance and conversion probability. The mechanism behind its impact is simple: faster delivery reduces user friction, lowers abandonment risk, and improves engagement metrics that search engines and ad platforms use to evaluate quality. Improving load speed therefore benefits website performance, conversion rate optimization, and paid traffic efficiency by making every visit more likely to produce a lead or sale. In practice, measuring and optimizing load speed requires focusing on specific metrics that map to user experience and business outcomes. The next subsections break down the experiential effects, the Core Web Vitals that quantify them, and practical benchmarks for paid-traffic landing pages.
How Does Page Load Speed Impact User Experience and Conversions?
Page load speed impacts user experience by shaping perceived responsiveness and first impressions, which in turn alter immediate behaviors like bounce, scroll, and click-through. When a landing page renders quickly users are more likely to engage with the call-to-action, complete forms, and progress through funnels, producing measurable uplifts in conversion rate. Recent performance studies show meaningful elasticity: single-second improvements often translate to mid-single-digit to low-double-digit percentage lifts in conversion, depending on vertical and device. Measuring these behavioral changes requires controlled A/B tests and careful KPI selection so you can attribute improvements to speed rather than content changes.
Web Vitals: Tools and Techniques for Optimizing Landing Page Load Speed
According to a recent study[1], 52% of users will abandon a website that takes more than 3 seconds to load. This highlights the importance of measuring website speed and responsiveness using effective performance optimization techniques. This paper delves into the significance of web performance tooling in measuring and optimizing key performance indicators (KPIs) known as “web vitals.” It explores popular tools such as Lighthouse, PageSpeed Insights, and WebPageTest, analyzing their functionalities and roles in enhancing web performance [2][3][4]. These tools help evaluate critical metrics like Largest Contentful Paint (LCP) and First Input Delay (FID), which directly impact userexperience. Additionally, the paper investigates the importance of optimizing core web vitals like LCP and FID and their impact on key metrics such as bounce rate, conversion rate, and time on site. Studies show even small delays in LCP, CLS and FID can negatively affect these business metrics[7].
Web performance tooling and the importance of web vitals, MK Dobbala, 2022
What Are Core Web Vitals and How Do They Measure Landing Page Performance?
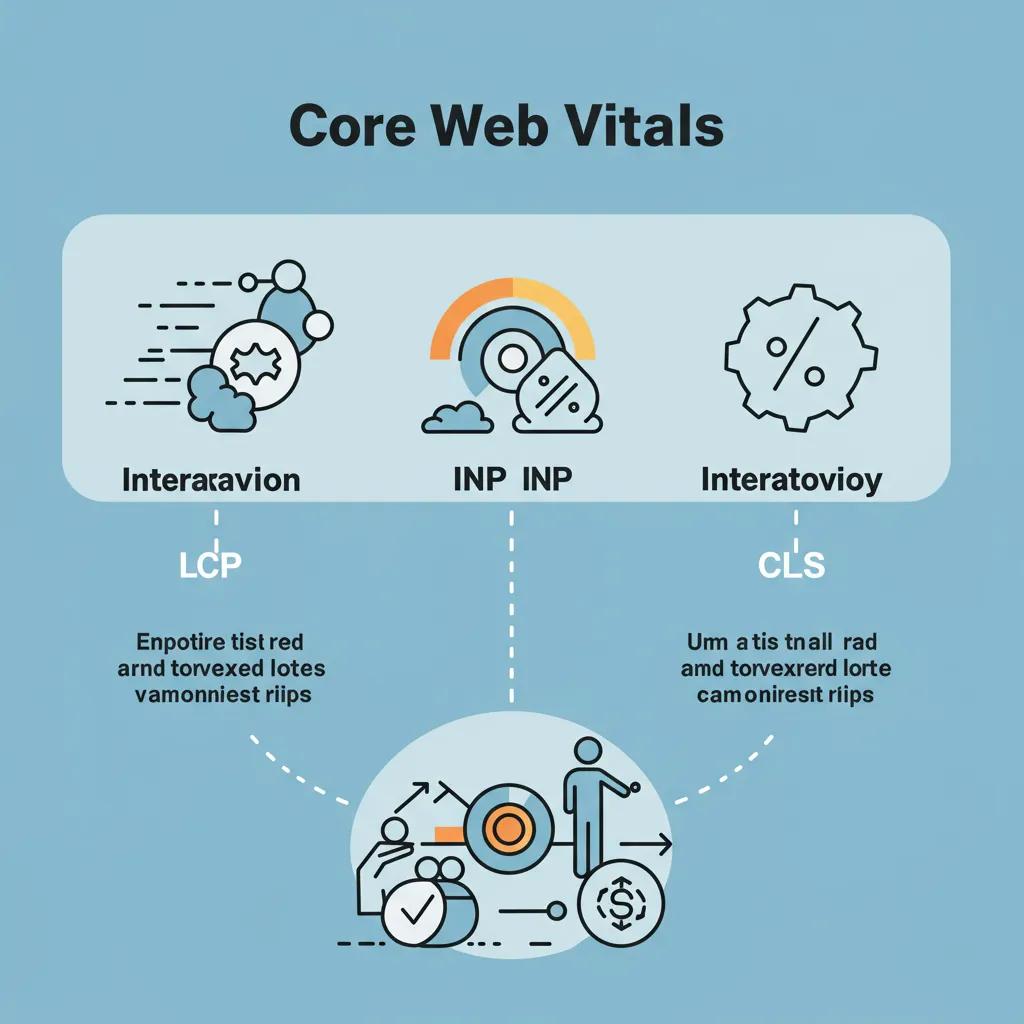
Core Web Vitals are a set of user-centric metrics that quantify load experience, interactivity, and visual stability—specifically LCP, INP, and CLS—and they are prioritized because they map directly to user satisfaction. Largest Contentful Paint (LCP) measures perceived load speed for main content, Interaction to Next Paint (INP) measures responsiveness during interactions, and Cumulative Layout Shift (CLS) captures visual stability; thresholds guide remediation priorities. Improving LCP typically involves reducing payload and render-blocking resources, improving INP requires less main-thread work and optimized event handling, and lowering CLS focuses on reserving space for images and dynamic content. Treating these metrics as business KPIs helps prioritize fixes that yield the largest conversion impact.
What Is a Good Landing Page Load Time for Optimal Performance?
A good landing page load time targets getting primary content visible within about 2–3 seconds on mobile and faster on desktop, with a practical aim for LCP under 2.5 seconds and time-to-interactive as low as feasible. Paid-traffic landing pages often benefit from stricter targets because purchased visits are time-sensitive and users expect near-instant results; aiming for under 2 seconds LCP can materially improve short-funnel conversions. Mobile experiences require especially tight budgets because network variation and device constraints magnify delays; testing under mobile throttling profiles reveals realistic user experiences. Setting realistic benchmarks tied to campaign KPIs lets teams decide whether to pause traffic, run fixes, or proceed with confidence.
How Can You Assess and Measure Your Landing Page Speed Effectively?
Assessing landing page speed effectively means using both lab and real-user tools to capture Core Web Vitals, waterfalls, and real-user trends so you can prioritize fixes based on impact and frequency. The mechanism is to combine synthetic tests (repeatable, comparable) with RUM (Real User Monitoring) to expose common user paths and edge-case slowdowns, enabling data-driven remediation. Proper measurement includes testing locations and throttling profiles that match campaign audiences, analyzing waterfall charts for render-blocking resources, and mapping tool outputs to business KPIs like bounce and conversion rate. Use the table below to compare primary tools by the metrics they report and the best use cases for each, which makes it easier to choose the right tool for each assessment phase.
Which tools provide accurate landing page speed metrics? The table below compares recommended tools and their primary applications.
| Tool | Primary Metrics Reported | Best Use Case |
|---|---|---|
| Google PageSpeed Insights / Lighthouse | Core Web Vitals, lab diagnostics, field data summary | Quick CWV checks and prioritized lab recommendations |
| WebPageTest | Waterfall, filmstrip, LCP, TTFB, advanced throttling | Deep waterfall analysis and synthetic emulation |
| GTmetrix | Combined scoring, request breakdown, historical tracking | Ongoing history and combined synthetic metrics |
| RUM platforms | Real-user LCP/INP/CLS distribution, device/network segmentation | Monitoring production user experience and segmentation |
Which Tools Provide Accurate Landing Page Speed Metrics?
Choosing tools depends on the phase: use PageSpeed Insights and Lighthouse for quick Core Web Vitals assessment, WebPageTest for waterfall and detailed timing, and RUM tools for production distribution across devices and networks. Each tool provides different signals—PageSpeed Insights aggregates field and lab data, WebPageTest shows request-level behavior including TTFB and resource blocking, while RUM reveals percentiles and outliers from real users. When running tests, always emulate mobile and geographic conditions that match campaign traffic, and repeat runs to account for variability. Combining multiple tools provides a fuller picture and prevents mis-prioritizing fixes based on a single noisy dataset.
How to Interpret Core Web Vitals Scores for Your Landing Page?
Interpreting Core Web Vitals requires mapping numerical thresholds to user impact: LCP under 2.5s is good, INP below ~200ms is desirable, and CLS under 0.1 indicates stable layouts; scores outside these ranges increase abandonment risk. Prioritize fixes that improve the largest number of failing sessions first—typically LCP and INP—because these yield the largest conversion gains when corrected. Use percentiles from RUM to understand how many users experience poor metrics and compute potential conversion lift by simulating impact on your baseline conversion rate. Translating scores into prioritized action reduces wasted effort and aligns technical work to marketing goals.
What Are Common Speed Bottlenecks Identified in Landing Page Assessments?
Common bottlenecks include oversized images, render-blocking JavaScript and CSS, slow server TTFB, and heavy third-party scripts such as tracking pixels or chat widgets that add main-thread work. Each bottleneck has targeted remediation: compress and serve images in modern formats, defer or async non-critical JS, enable server-side caching, and audit third-party providers for lightweight alternatives. Identifying the actual cause requires waterfall analysis and RUM segmentation so you can avoid blanket optimizations that break functionality. Addressing these common issues early will typically yield the fastest measurable improvements in Core Web Vitals and conversion performance.
What Are the Most Effective Techniques to Optimize Landing Page Load Speed?
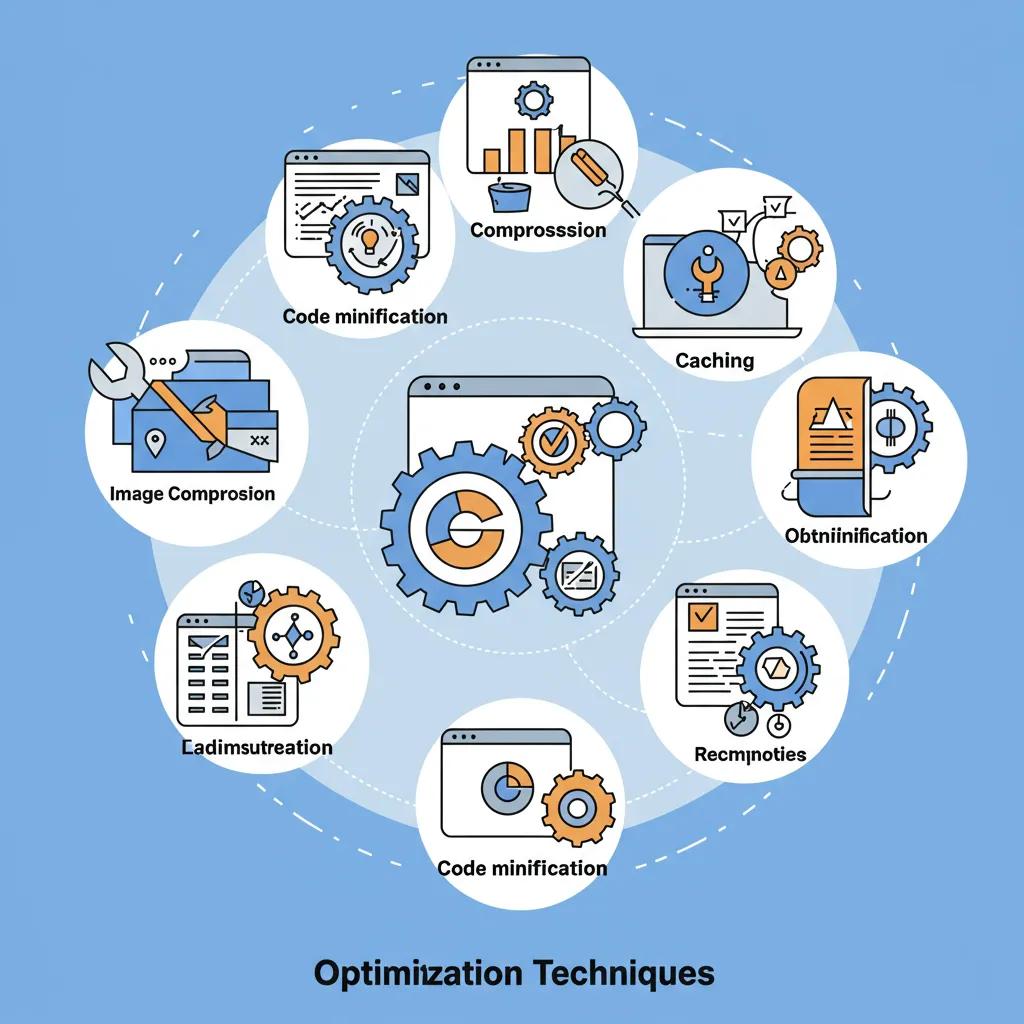
Optimizing landing page load speed relies on a set of high-impact techniques—image optimization, code minification and compression, caching plus CDN, mobile-first payload reduction, and server-side latency reduction—that collectively reduce LCP, INP, and TTFB. The mechanism is to shrink the critical rendering path, reduce network round-trips, and minimize main-thread work so content appears faster and interactions respond promptly. Implementing these techniques yields benefits such as lower bounce, improved engagement, and more efficient use of paid traffic budgets because each click has higher conversion probability. The EAV-style table below compares key techniques, their primary effect on LCP, INP, or CLS, and example tools or implementation notes to guide prioritized work. After you review techniques, consider a landing page performance audit to sequence fixes before scaling traffic.
| Optimization Approach | Effect on Core Metric | Example Tools & Implementation Notes |
|---|---|---|
| Image Optimization | Improves LCP by reducing payload | Use responsive srcset, WebP/AVIF, automated compression |
| Code Minification & Compression | Lowers INP and TTFB by shrinking assets | Minify, bundle where appropriate, enable Brotli/gzip |
| Caching & CDN | Reduces TTFB and improves global LCP | Set cache-control headers, use edge CDN with invalidation plan |
| Lazy Loading & Critical CSS | Improves initial render and LCP | Inline critical CSS, defer non-critical CSS/JS, lazy-load offscreen images |
| Server & Backend Optimizations | Reduces TTFB and consistent INP | Use server-side caching, optimize database queries, consider edge hosting |
- Optimize images: Convert to WebP/AVIF and resize to viewport dimensions for a large LCP reduction.
- Minify and compress: Enable Brotli/gzip and minify CSS/JS to reduce transfer size and improve INP.
- Leverage caching and CDN: Use far-future cache-control headers for static assets to lower TTFB globally.
After applying these steps, measure again to confirm improvements and iterate on the next priority items.
When describing optimization options, it’s valuable to audit before scaling traffic: for faster prioritization and an action plan, Wholesale Premium Traffic offers a Landing page performance assessment and consultation that audits bottlenecks and sequences fixes before sending significant paid visits. This landing page performance assessment and consultation complements technical optimizations by aligning fixes with campaign timing and expected ROI.
How Does Image Optimization Improve Landing Page Performance?
Image optimization speeds landing pages by reducing payload size, using responsive delivery, and preventing layout shifts through reserved dimensions, which directly improves LCP and CLS. Techniques include serving modern formats like WebP or AVIF where supported, implementing srcset and sizes for responsive images, and enabling lazy loading for offscreen assets to defer non-critical downloads. Tools and build steps such as automated image pipelines and CDNs with on-the-fly conversion can reduce manual effort and ensure consistent compression. These practices typically yield large first-order gains for visual-heavy landing pages and are often the quickest wins in an audit.
Impact of Image Performance and Load Speed on SaaS Landing Pages
This thesis explores how images performance, specifically load speed and quality, affects SaaS landing pages. It highlights the negative impact when a landing page does not implement image optimizing techniques, and loads images that are unnecessarily large or unoptimized, leading to slower load times and potentially lower conversion rates.
How image performance impact SaaS landing pages, 2024
What Role Does Code Minification and Compression Play in Speed Optimization?
Code minification and compression reduce transfer size and parsing time, thereby lowering both LCP and INP by shrinking the amount of JavaScript and CSS that must be downloaded and executed. Implement minification, tree-shaking, and bundle splitting during build, and enable Brotli or gzip on the server to compress responses. Reducing unused JavaScript, deferring non-critical modules, and avoiding large runtime frameworks for simple landing pages improve interactivity. Combined, these techniques streamline the critical rendering path and reduce main-thread work, which helps interactions feel immediate for users.
SEO for Faster Website Loads and Improved User Engagement
This paper explores how SEO techniques on website performance metrics, particularly focusing on loading speeds, can be used to improve user engagement. It discusses how minifying code reduces file size and speeds up website loading, and the use of web platforms or other methods to enhance performance.
How SEO makes website loads faster and helps in user engagement, 2024
How Can Caching and Content Delivery Networks Enhance Load Times?
Caching and CDNs decrease latency by serving static assets from geographically closer edge nodes and reducing origin hits, which improves TTFB and global LCP consistency. Implement cache-control and far-future headers for immutable assets, set up sensible cache invalidation workflows for updated landing pages, and use a CDN that offers edge caching plus image optimization. Server-side caching (reverse proxies, Varnish-style) reduces backend processing for high-traffic landing pages. Proper cache policies and CDN selection provide predictable performance at scale, especially for paid traffic surges.
Why Is Mobile-First Optimization Critical for Landing Page Speed?
Mobile-first optimization is essential because most paid and organic traffic arrives on mobile devices with variable networks and limited CPU, so reducing payload and prioritizing above-the-fold content preserves conversions. Strategies include delivering reduced image sizes for mobile, inlining critical CSS, minimizing JS execution, and testing under realistic mobile throttling. Real-device testing and RUM segmentation reveal where mobile users diverge from lab expectations and guide targeted reductions. Adopting a mobile-first posture ensures landing page speed targets are met for the most constrained and conversion-sensitive users.
How to Optimize Server Response Time and Reduce Latency?
Optimizing server response time reduces TTFB by using server-side caching, optimizing database queries, and deploying edge or regionally proximate hosting for target audiences. Implement server-level compression, keep landing pages lightweight at the backend by serving static HTML where possible, and use persistent connections and HTTP/2 or HTTP/3 to improve multiplexing. Profiling backend request handling uncovers expensive operations that can be cached or deferred. These server-side changes stabilize performance and ensure that front-end optimizations are not negated by slow origins.
How Does Landing Page Speed Directly Affect Conversion Rates and ROI?
Landing page speed affects conversion rates and ROI because faster pages increase the proportion of engaged visitors who complete desired actions, directly improving return on ad spend by converting more of the same traffic. The mechanism is measurable: reductions in LCP and INP reduce bounce and increase time-on-page and click-throughs, which scales conversion lifts proportionally to traffic volume. For paid traffic buyers, even small percentage improvements translate to sizable ROI changes when scaled across thousands of clicks. The table below maps key metrics to benchmark thresholds and estimated conversion impact to help quantify potential business gains.
| Metric | Benchmark Threshold | Conversion Impact Estimate |
|---|---|---|
| LCP | < 2.5 s | Good: baseline conversions; 1s faster often yields +5–12% conversions |
| INP | < 200 ms | Faster interactions reduce drop-off during form or CTA clicks |
| CLS | < 0.1 | Low layout shift increases trust and CTA accuracy, reducing errors |
| TTFB | < 200–500 ms | Faster server responses keep initial rendering and tracking accurate |
What Are the Latest Industry Statistics on Page Speed and Conversion Impact?
Recent industry data indicates that a single-second delay can reduce conversions by roughly 5–7% and that pages loading within 1–2 seconds often convert multiple times better than 4–5 second pages in verticals with short funnels. Mobile abandonment statistics show significant drop-off beyond 3 seconds, and improvements to Core Web Vitals correlate with both reduced bounce rates and higher engagement metrics. These statistics underscore why speed is not just a technical KPI but a fundamental marketing lever for paid campaigns. Quantifying these effects for your pages via A/B testing provides the most reliable local estimate of conversion lift.
How Can Faster Load Times Reduce Bounce Rates and Increase Engagement?
Faster load times reduce bounce by meeting user expectations quickly, which increases time-on-page and the likelihood of interacting with CTAs and forms; this creates measurable uplifts in downstream metrics like lead quality and revenue per visitor. To measure engagement improvements, track pre- and post-optimization KPIs using A/B tests with conversion goals, and segment results by device and source to see where the improvements matter most. Faster pages also enable more reliable behavior measurement because events and tracking fire sooner, improving attribution accuracy. Use incremental experiments to validate the causal relationship between speed improvements and engagement metrics.
Why Is Speed Optimization Essential for Solo Ad Traffic Campaign Success?
Solo ad campaigns deliver concentrated, high-intent visits quickly, so slow landing pages can waste significant ad spend by losing users in the first seconds; speed optimization ensures purchased clicks have the best chance to convert. The operational pattern that mitigates risk is simple: audit the landing page, prioritize and implement fixes, then scale traffic. This audit-first approach preserves budget and increases ROI because guaranteed clicks from quality solo ad traffic perform far better on optimized pages. For campaign-ready packaging, Wholesale Premium Traffic pairs solo ad traffic services with landing page assessments so clients can request targeted audits and align delivery with page readiness to maximize results.
How Can You Continuously Monitor and Maintain Optimal Landing Page Speed?
Continuous monitoring maintains optimal landing page speed by combining RUM dashboards, synthetic tests, and scheduled audits so regressions are detected early and fixed before they impact campaigns. The mechanism is to track Core Web Vitals percentiles, payload size, number of requests, and TTFB over time and set alerts for threshold breaches; this ensures that content changes or third-party updates don’t silently degrade performance. A monitoring stack that includes site-level CWV alerts plus periodic WebPageTest runs provides both trend and diagnostic visibility. The following list shows essential monitoring components to include in an ongoing performance program.
- RUM dashboards: Track CWV percentiles and segment by device and geography.
- Synthetic tests: Run scheduled WebPageTest or Lighthouse checks to capture waterfall data.
- Alerting: Configure threshold-based alerts for LCP, INP, CLS, and TTFB deviations.
What KPIs Should You Track to Measure Landing Page Speed and Performance?
Track Core Web Vitals (LCP, INP, CLS) as primary KPIs, and augment them with TTFB, total payload size, number of requests, and conversion-related metrics like bounce rate and CTA completion. Mapping these technical KPIs to business KPIs produces actionable alerts—for example, an LCP spike correlated with a drop in CTA clicks signals urgent remediation. Use percentiles (75th or 95th) rather than averages to capture the experience of most affected users. Consistently tracking these KPIs ties technical work directly to marketing outcomes and informs budget decisions for optimization.
How Often Should You Audit and Update Your Landing Page for Speed?
Audit landing pages monthly for Core Web Vitals and run full synthetic audits quarterly or after any major content, design, or script changes; additionally re-audit ahead of any planned paid traffic spikes or solo ad deliveries. Event-driven audits—triggered when new tracking or third-party scripts are added—prevent regressions from shipping unchecked. Maintaining a cadence of small iterative audits preserves stability and prevents large rework cycles that interrupt campaigns. Combine automated monitoring with scheduled manual inspections to ensure both trend detection and in-depth diagnosis.
Which Tools Help Monitor Speed Trends and Detect Performance Issues?
Combine Google Search Console and PageSpeed Insights for CWV visibility, WebPageTest for detailed waterfall and filmstrip diagnostics, and GTmetrix or RUM services for historical tracking and segmentation. Set up synthetic test schedules and integrate RUM alerts to capture both regression signals and diagnostic traces that point to root causes. Dashboards that correlate technical metrics with conversion data enable faster prioritization of fixes that affect revenue. This tool mix balances lab and field signals so you can act confidently.
What Are Best Practices for Integrating Landing Page Speed Optimization with Traffic Quality?
Best practices for integrating speed optimization with traffic quality start with an audit-first workflow that assesses landing pages, sequences fixes by impact, and only then ramps paid traffic—this reduces wasted spend and increases conversion efficiency. The mechanism is to align technical remediation with campaign timelines so optimizations are in place before large traffic deliveries. Integrating CRO and speed work ensures that when performance improves, the page content and CTA are also optimized to capture incremental gains. Below is a recommended operational checklist for campaign-ready integration.
- Audit before traffic: Validate CWV and remove critical bottlenecks prior to sending paid clicks.
- Prioritize fixes by revenue impact: Triage tasks that provide the largest conversion lift per hour of work.
- Bundle services when possible: Combine landing page assessment with targeted traffic delivery for coordinated execution.
How Does Landing Page Assessment Complement Solo Ad Traffic Services?
A landing page assessment complements solo ad traffic services by identifying bottlenecks and sequencing fixes so that purchased clicks are not wasted on slow or unstable pages; this audit-first model increases conversion efficiency. The assessment uncovers issues such as oversized media, blocking scripts, or server latency that directly reduce campaign performance, and it produces a prioritized remediation plan tied to conversion impact. After optimization, targeted solo ad traffic produces higher-quality leads and better email follow-up performance because users reach intended assets reliably. Wholesale Premium Traffic’s landing page assessment service works as the assessment stage in an assess→fix→send traffic workflow and can be bundled with solo ad traffic services for coordinated delivery.
What Conversion Rate Optimization Strategies Work Best with Fast Landing Pages?
Conversion Rate Optimization strategies that compound with speed improvements focus on simplifying above-the-fold content, clarifying the CTA, and reducing form friction so that faster load times translate into actual conversions. Use progressive profiling to shorten initial forms, prioritize headline and CTA clarity for immediate comprehension, and A/B test variations once speed improvements stabilize user experience. Fast pages also allow you to test richer micro-interactions without sacrificing responsiveness, improving perceived professionalism and trust. Paired with speed work, these CRO tactics increase the conversion yield of every visitor.
How to Use Structured Data and Semantic Markup to Enhance Landing Page Visibility?
Structured data and semantic markup clarify page content for search engines and can enhance SERP presentation by enabling rich results, which improves click-through rates and aligns messaging before the visit even begins. Implement Organization and Service markup for brand clarity, Article or FAQ schema for content-rich pages, and ImageObject with proper alt text to support visual indexing while preserving performance. Use schema that matches actual content and avoid excessive markup that creates maintenance overhead. Semantic clarity in markup complements speed and CRO by attracting better-matched visitors who are more likely to convert.
What Are Common FAQs About Landing Page Load Speed Optimization?
This FAQ section answers frequent practical questions about speed optimization with concise, actionable guidance to support quick decision-making before deeper audits. Each answer is designed to be snippet-friendly and points to operational next steps like prioritized quick wins, triage for third-party scripts, and tool recommendations. These short answers help marketers and developers get immediate advice they can apply before commissioning a full assessment.
How Do I Optimize My Landing Page Speed Quickly and Effectively?
Quick optimization focuses on low-effort, high-impact items: compress and convert images, enable server compression and caching, and defer or remove non-critical third-party scripts to reduce main-thread work. Start with automated image optimization and a WebPageTest waterfall to identify the largest blocking assets, then enable Brotli/gzip and far-future caching for static assets. After these quick wins, re-measure Core Web Vitals to confirm improvements and plan the next set of fixes. If you prefer expert prioritization, a Landing page performance assessment and consultation can sequence these steps and provide a tailored roadmap.
What Is the Impact of Third-Party Scripts on Landing Page Load Time?
Third-party scripts can significantly increase INP and TTFB by adding parsing and execution time or by delaying critical resource loads, and they often introduce unpredictable regressions when vendors update. Triage scripts by measuring their individual impact in a controlled environment, then defer, load asynchronously, or replace with lighter alternatives when necessary. Use tag managers and performance-optimized vendors to retain functionality while minimizing impact. Ongoing RUM monitoring helps detect third-party regressions early.
How Do Core Web Vitals Affect SEO and User Experience?
Core Web Vitals affect SEO because search engines use them as user-centric ranking signals, and they affect user experience because they quantify how quickly and stably users can consume content and complete interactions. Improving CWV can increase organic visibility and improve engagement metrics, which often leads to more sustained traffic and higher conversions. Treat CWV as both a technical and marketing KPI to ensure alignment between engineering and growth objectives.
What Are the Best Tools for Measuring and Improving Landing Page Speed?
The best toolkit mixes PageSpeed Insights for Core Web Vitals, WebPageTest for waterfalls and diagnostics, GTmetrix for historical tracking, and RUM services for production distribution and segmentation, providing a balanced view across lab and field data. Use each tool according to its strengths—Lighthouse for lab audits, WebPageTest for deep dives, and RUM for percentile-based monitoring—so you can both locate causes and measure user impact. Combine these tools into a monitoring and remediation workflow to keep landing pages optimized over time.
This article has provided a structured, operational approach to assessing, optimizing, and monitoring landing page load speed with practical techniques, prioritized checklists, and business-focused metrics so you can protect and improve conversion outcomes for both organic and paid traffic campaigns.